top of page
This site was designed with the
.com
website builder. Create your website today.
Start Now
A short two-part workshop on transcriptomics at PSU
Home
RNA-seq playlist
More
Use tab to navigate through the menu items.
Facebook
Twitter
Pinterest
Tumblr
Copy Link
Link Copied
Play Video
Play Video
18:26
StatQuest with Josh Starmer
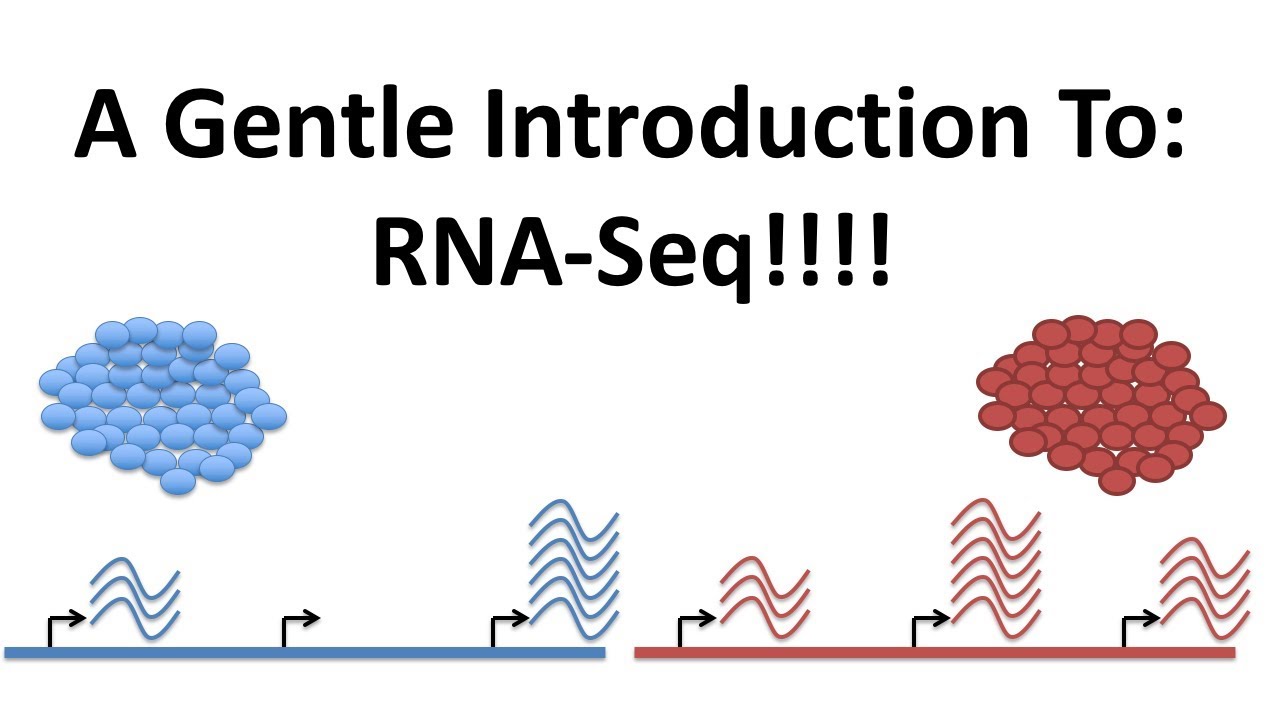
StatQuest: A gentle introduction to RNA-seq
RNA-seq may sound mysterious, but it's not. Here's go over the main ideas behind how it's done and how the data is analyzed. NOTE: If you want to learn about ChIP-seq, check out the StatQuest: https://youtu.be/nkWGmaYRues For a complete index of all the StatQuest videos, check out: https://statquest.org/video-index/ If you'd like to support StatQuest, please consider... Patreon: https://www.patreon.com/statquest ...or... YouTube Membership: https://www.youtube.com/channel/UCtYLUTtgS3k1Fg4y5tAhLbw/join ...buying one of my books, a study guide, a t-shirt or hoodie, or a song from the StatQuest store... https://statquest.org/statquest-store/ ...or just donating to StatQuest! https://www.paypal.me/statquest Lastly, if you want to keep up with me as I research and create new StatQuests, follow me on twitter: https://twitter.com/joshuastarmer #statquest #rnaseq
Play Video
Play Video
04:25
DataCamp
R Tutorial : RNA-Seq Workflow
Want to learn more? Take the full course at https://learn.datacamp.com/courses/rna-seq-with-bioconductor-in-r at your own pace. More than a video, you'll learn hands-on coding & quickly apply skills to your daily work. --- Now that you know a bit about the types of questions that RNA-Seq experiments can address, and how we use this technique to understand more about the genes important to a particular disease or condition, let's explore the steps required for the analysis workflow. Prior to starting the RNA-Seq workflow, planning is essential. This step in the analysis is crucial for good results, as there is often no saving a poorly designed experiment. There are a couple of important considerations during planning, including replicates, batch effects, and confounding: For RNA-Seq experiments there is generally low technical variation, so invest in biological replicates instead. The more biological replicates you have, the better the estimates are for mean expression and variation, leading to more robust analyses; be sure to have at least 3. Also, an experiment performed as different batches can confound your analysis. As much as possible try to perform experimental steps across all conditions at the same time, and if you cannot avoid batches, distribute the samples from each sample group into each batch. Finally, avoid confounding your experiment with major sources of variation. For example, if your animals are of different sexes, don't have all-male mice as control and all-female mice as treatment, as you won't be able to differentiate the treatment effect from the effect of sex. After you have a well-planned out the experiment, you can begin with sample preparation. When preparing RNA-Seq libraries, the samples are harvested, the RNA is isolated and DNA contamination is removed. The rRNA is removed or mature mRNAs are selected by their polyA tails. Then, the RNA is turned into cDNA, fragmented, size selected and adapters are added to generate the RNA-Seq libraries to be sequenced. The sequencing generates millions of nucleotide sequences called reads. The reads correspond to ends of the fragments sequenced. The sequence of each read is output into FASTQ files. After acquiring the FASTQ files, we can start with the computational analysis. The first step in the analysis is to assess the quality of the raw data. At this step, we ensure something didn't go wrong at the sequencing facility and explore the data for contamination, such as vector, adapter, or ribosomal. The next step is alignment or mapping to the genome to determine the location on the genome where the reads originated. Since mRNA contains only the exons needed to create the proteins when the mRNA is aligned to the genome containing introns, some of the reads will be split across introns. Therefore, tools for aligning reads to the genome need to align across introns for RNA-seq. The output of alignment gives the genome coordinates for where the read most likely originated from in the genome and information about the quality of the mapping. Following alignment, the reads aligning to the exons of each gene are quantified to yield a matrix of gene counts. For the entire process up until this point in the workflow, we use command-line tools, which can handle the large sequencing files and computational demands. Therefore, we will not perform these steps in the current course. This course will focus on the identification of differentially expressed genes using these count matrices as input. The analysis will be performed in R using predominantly Bioconductor packages. We can read into R the count matrix using the read.csv() function and specifying the file. The gene count matrix is arranged with the samples as columns and gene IDs as rows. The count values represent the number of reads or fragments aligning to the exons of each gene. Once we have count data, differential expression analysis is performed by comparing the expression of each gene between the specified conditions. The output of the statistical analysis includes the log2 fold changes of expression between conditions and the adjusted p-values for each gene. Genes that reach a threshold for significance can be subset to define a list of significant differentially expressed genes. Now that we have a general understanding of the workflow and have the count's file loaded, we can get started. Now let's explore the workflow. #DataCamp #RTutorial #RNASeqwithBioconductorinR
Play Video
Play Video
12:42
StatQuest with Josh Starmer
StatQuest: DESeq2, part 1, Library Normalization
DESeq2 is a complicated program used to identified differentially expressed genes. Here I clearly explain the first thing it does, normalize the libraries. There is an error at 9:28: I have log(reads for gene X) - log(average for gene X), but it should be: log(reads for gene X) - average(log values for gene for gene X). We are subtracting the geometric mean from each gene measurement. For a complete index of all the StatQuest videos, check out: https://statquest.org/video-index/ If you'd like to support StatQuest, please consider... Patreon: https://www.patreon.com/statquest ...or... YouTube Membership: https://www.youtube.com/channel/UCtYLUTtgS3k1Fg4y5tAhLbw/join ...buying one of my books, a study guide, a t-shirt or hoodie, or a song from the StatQuest store... https://statquest.org/statquest-store/ ...or just donating to StatQuest! https://www.paypal.me/statquest Lastly, if you want to keep up with me as I research and create new StatQuests, follow me on twitter: https://twitter.com/joshuastarmer Correction: 9:28 I have log(reads for gene X) - log(average for gene X), but it should be: log(reads for gene X) - average(log values for gene for gene X). We are subtracting the geometric mean from each gene measurement. In other words, if you take 'the average of reads' to be the geometric average, it all hangs neatly together. #statquest #rnaseq #deseq2
Play Video
Play Video
14:17
StatQuest with Josh Starmer
StatQuest: edgeR, part 1, Library Normalization
edgeR, like DESeq2, is a complicated program used to identify differentially expressed genes. Here I clearly explain how it normalized libraries. For a complete index of all the StatQuest videos, check out: https://statquest.org/video-index/ If you'd like to support StatQuest, please consider... Patreon: https://www.patreon.com/statquest ...or... YouTube Membership: https://www.youtube.com/channel/UCtYLUTtgS3k1Fg4y5tAhLbw/join ...buying one of my books, a study guide, a t-shirt or hoodie, or a song from the StatQuest store... https://statquest.org/statquest-store/ ...or just donating to StatQuest! https://www.paypal.me/statquest Lastly, if you want to keep up with me as I research and create new StatQuests, follow me on twitter: https://twitter.com/joshuastarmer #statquest #rnaseq #edger
Play Video
Play Video
21:24
StatQuest with Josh Starmer
StatQuest: edgeR and DESeq2, part 2 - Independent Filtering
This explains edgeR and DESeq2's different approaches to filtering out genes with low read counts. The code mentioned is at https://statquest.org/statquest-filtering-genes-with-low-read-counts/ For a complete index of all the StatQuest videos, check out: https://statquest.org/video-index/ If you'd like to support StatQuest, please consider... Patreon: https://www.patreon.com/statquest ...or... YouTube Membership: https://www.youtube.com/channel/UCtYLUTtgS3k1Fg4y5tAhLbw/join ...buying one of my books, a study guide, a t-shirt or hoodie, or a song from the StatQuest store... https://statquest.org/statquest-store/ ...or just donating to StatQuest! https://www.paypal.me/statquest Lastly, if you want to keep up with me as I research and create new StatQuests, follow me on twitter: https://twitter.com/joshuastarmer #statquest #deseq2 #edgeR
Play Video
Play Video
StatQuest with Josh Starmer
StatQuest: P Values, clearly explained
NOTE: This StatQuest has been updated: https://youtu.be/JQc3yx0-Q9E Check that one out, especially if the last example confuses you. ⭐ NOTE: When I code, I use Kite, a free AI-powered coding assistant that will help you code faster and smarter. The Kite plugin integrates with all the top editors and IDEs to give you smart completions and documentation while you’re typing. I love it! https://www.kite.com/get-kite/?utm_medium=referral&utm_source=youtube&utm_campaign=statquest&utm_content=description-only People often confuse p-values with probabilities. Here I show you how to calculate both and demonstrate their differences. The simple explanation means the concepts are easy to remember. For a complete index of all the StatQuest videos, check out: https://statquest.org/video-index/ If you'd like to support StatQuest, please consider... Patreon: https://www.patreon.com/statquest ...or... YouTube Membership: https://www.youtube.com/channel/UCtYLUTtgS3k1Fg4y5tAhLbw/join ...a cool StatQuest t-shirt or sweatshirt (USA/Europe): https://teespring.com/stores/statquest (everywhere): https://www.redbubble.com/people/starmer/works/40421224-statquest-double-bam?asc=u&p=t-shirt ...buying one or two of my songs (or go large and get a whole album!) https://joshuastarmer.bandcamp.com/ ...or just donating to StatQuest! https://www.paypal.me/statquest Lastly, if you want to keep up with me as I research and create new StatQuests, follow me on twitter: https://twitter.com/joshuastarmer 0:00 Awesome song and introduction 0:26 p-values are related to, but not the same as probabilities 3:50 Calculating another p-value 7:09 Calculating a more complicated p-value 11:02 p-values for continuous data like height 13:43 A tricky example #statquest #pvalue
RNA-seq playlist: Online Classes
bottom of page